The current account deficit is broader than the generally well-known trade deficit because it includes the deficit (or surplus) on investments and both personal (think foreigners sending money home) and government (think foreign aid or military assistance) transfer payments. A current account is the difference between exports and imports plus the difference between interest and dividends received from foreigners or paid to foreigners plus the difference in transfer payments paid or received. It is a current account deficit when the total amount of money leaving a country across these three categories exceeds the amount coming in; most commonly this occurs when imports exceed exports. The current account deficit and the federal budget deficit are often erroneously linked in discussions of the “twin deficits.”
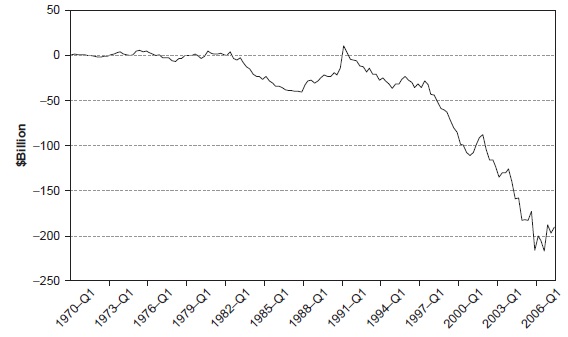
As Figure 1 shows, the United States has experienced a current account deficit for all but one quarter (the first quarter of 1991) over the past 25 years. Virtually all forecasters expect this deficit to continue for years to come.
Figure 1 The Current Account Deficit
Source: Data from Bureau of Economic Analysis.
The one positive number came about when several countries (most notably Germany, Japan, and Saudi Arabia) offered to contribute billions to the United States to pay for the cost of the Persian Gulf War on the condition that the contributions be used solely for the defense budget and not in any way to reduce the overall federal budget deficit. Then Defense Secretary Dick Cheney discovered that the Feed and Foraging Act of 1864 was still the law governing such contributions and that it allowed donations of money or goods and services to be used only for defense (or war) purposes. So much money came in that it gave the United States a one-quarter surplus on the current account. It also meant the United States made a profit on that war.
The basic economic principle to keep in mind is that the balance of payments for every country in the world is identical, namely, zero. This is an iron law of international accounting and has nothing to do with any theory.
This simply means that every country that has a current account deficit has a capital account surplus (an inflow of foreign money) of exactly the same amount. Any country with a current account surplus (such as China, Germany, or Japan) has a capital account deficit (an outflow of money to other countries) that exactly offsets the current account surplus.
The data do not provide any way to separate which side is driving the situation. Some commentators argue that because the return on investment that foreigners expect to earn by investing in the United States is so attractive, they continue to pour money into the United States at a rapid rate. So much of this has gone into direct investment that the Bureau of Labor Statistics now estimates as many as one out of every six employed people in the United States works for a foreign company such as BMW, British Petroleum, Four Seasons, Nissan, Shell, or Toyota.
If these people are correct, then the U.S. current account deficit will remain huge. Of course, trends that become unsustainable must stop and turn around, so sooner or later this will change.
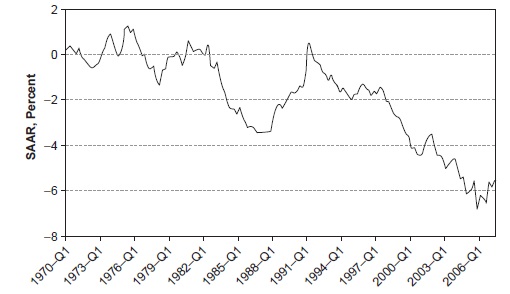
Figure 2 shows the current account deficit as a share of gross domestic product (GDP), the total value of all the goods and services produced for final demand within the borders of the United States. The current account deficit appears to have stabilized in 2006 at approximately 6.6 percent of GDP.
Figure 2 The Current Account Deficit: Percentage of GDP
Source: Data from Bureau of Economic Analysis.
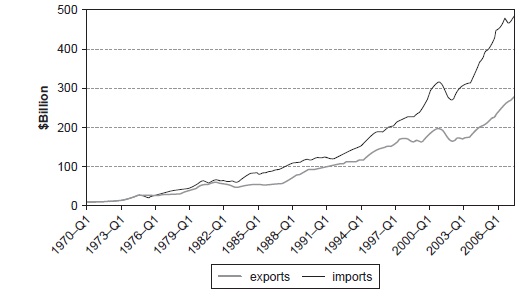
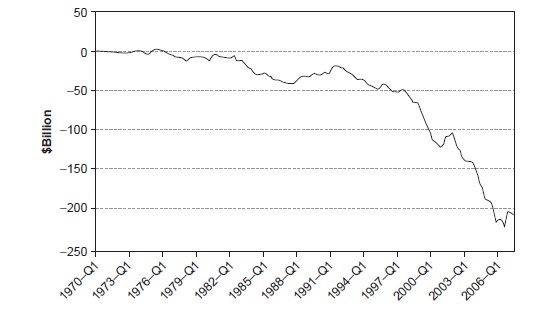
Other analysts believe that it is the appetite of U.S. consumers for foreign goods that drives the current account deficit. Figures 3 and 4 show the huge and growing discrepancy between imports and exports of goods. The largest part of this trade deficit is due to motor vehicles (think of all the Jaguar, Lexus, and high-end BMW and Mercedes-Benz vehicles in the United States), and the largest deficit with a single country, which is unrelated to motor vehicle sales, is the one with China, which was $201.5 billion in 2005.
Figure 3 Exports and Imports: Goods
Source: Data from Bureau of Economic Analysis.
Figure 4 The Trade Deficit: Goods
Source: Data from Bureau of Economic Analysis.
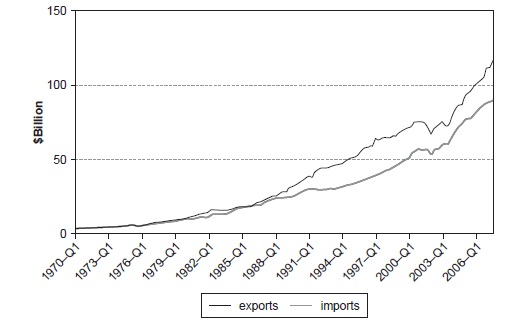
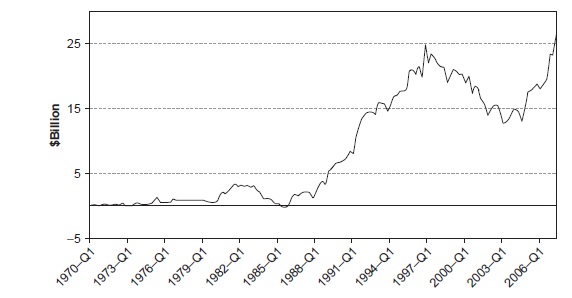
Figures 5 and 6 show that in the realm of services (education, entertainment, health care, travel, and so on), the United States has a large surplus. This surplus was $66.0 billion in 2005.
Figure 5 Exports and Imports: Services
Source: Data from Bureau of Economic Analysis.
Figure 6 The Trade Surplus: Services
Source: Data from Bureau of Economic Analysis.
Much research has shown that approximately 70 percent of U.S. imports of goods are from affiliates of the same company. These imports are part of complicated corporate supply chain strategies and are not likely to change much due to normal ups and downs in the value of the dollar.
The best example of this is U.S. vehicle producers. The United States and Canada have had a free trade agreement since 1988, and this has led to a complete interchange of vehicles and parts between the two countries. After the North American Free Trade Agreement (NAFTA), which began on January 1, 1995, went into full effect, the same became true of vehicle and parts production in Mexico.
The United States and Canada are the world’s two largest trading partners. Total trade between the two countries was a little over $500 billion in 2005 as compared with $290 billion with Mexico, $285 billion with China, and a little over $193 billion with Japan.
The group that thinks it is imports of goods driving the current account deficit always argues for a decline in the dollar to reverse or at least ameliorate the situation. However, this remedy is unlikely to work because the magnitude of decline for the dollar needed is too large and because so many corporate supply chain relationships would have to change dramatically.
Of course, if it is the attractiveness of the United States as a place to invest that is driving the current account deficit, then a decline in the dollar would only exacerbate the situation. This is frustrating to some people.
The Bureau of Economic Analysis of the U.S. Department of Commerce publishes updated information on the current account every 3 months. It also publishes monthly estimates of the trade deficit.
It seems likely the United States will have a current account deficit for many years to come. It will probably shrink as a share of GDP, but it is unlikely to disappear for a long time, if ever.
Bibliography:
- Bureau of Economic Analysis. (https://www.bea.gov/).
- Houthakker, Hendrick S. and Stephen P. Magee. 1969. “Income and Price Elasticities in World Trade.” Review of Economics and Statistics 51:111-25.
- Mann, Catherine L. 1999. Is the U.S. Trade Deficit Sustainable? Washington, DC: Institute for International Economics.
This example Current Account Deficit Essay is published for educational and informational purposes only. If you need a custom essay or research paper on this topic please use our writing services. EssayEmpire.com offers reliable custom essay writing services that can help you to receive high grades and impress your professors with the quality of each essay or research paper you hand in.


