
The Gini coefficient is a popular statistical measure of income inequality. It was developed by an Italian statistician, Corrado Gini, in 1912 as a measure of concentration applicable to the distribution of wealth, income, or any other continuous variable. Gini coefficients can range from a minimum of 0 (perfect equality) to a maximum of 1 (perfect inequality). Higher values of the Gini indicate greater income inequality, or income concentration, whereas lower values indicate more equality. In a hypothetical society with perfect equality, the Gini = 0 and all families or persons receive an income equal to the average, whereas in a society with perfect inequality, Gini = 1 and a single family or person receives all income.
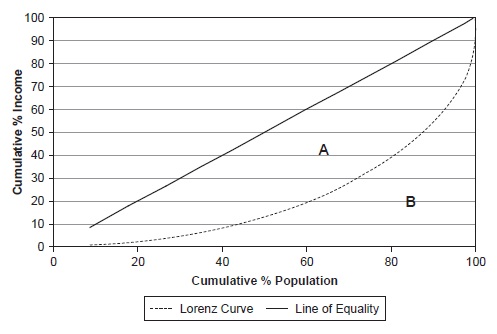
Gini coefficients have an intuitive interpretation because the measure can be represented graphically on a Lorenz curve (see Figure 1). A Lorenz curve has several components: a 45-degree line representing the line of perfect equality, the cumulative proportion of the population plotted on the horizontal axis, and the cumulative proportion of income plotted on the vertical axis. The Lorenz curve plots the degree of deviation from the 45-degree line of perfect equality. The Gini coefficient is sometimes called a ratio because it reflects the ratio between the 45-degree line of equality and the Lorenz curve relative to the total area. Thus, if the area between the line of perfect equality and the Lorenz curve is A, and B represents the area below the Lorenz curve, then the Gini ratio is equal to A/(A+B).
Figure 1 Lorenz Curve of U.S. Adjusted Gross Income, 2005
The Gini coefficient is satisfactory on a number of grounds. It follows the principle of transfers because when income is redistributed from a richer person or family to a poorer one, the Gini index decreases, and when income is redistributed from a poorer to a richer individual or family, it increases. Gini coefficients are also scale-invariant in that when all incomes are increased by some constant, the Gini coefficient yields the same result. In practical terms, this means that Gini coefficients are not affected by inflation.
The Gini coefficient of U.S. family income has been reported by the Census Bureau since 1947. In 1968 the Gini coefficient reached a low of 0.348, whereas in 2005 the Gini coefficient reached 0.440. The increase reflects the general trend of rising income inequality in the United States. A calculation of the Gini coefficient using 2005 data from the U.S. Internal Revenue Service, based on a more comprehensive income definition than the census, yields a Gini coefficient of 0.587.
Despite its strengths, the Gini coefficient is not without criticism. Social scientists have pointed out that the Gini index is more sensitive to the middle of a typical income distribution. In other words, when transfers occur between very rich or very poor individuals, the Gini coefficient will be less sensitive (i.e., will not register much change) than when changes occur among middle-income families or persons. Another problem is that the Gini coefficient does not have an intuitive method for decomposing inequality into an additive within-group and between-group component, but social scientists (mostly economists) have provided potential techniques for decomposing the index.
Bibliography:
- Allison, Paul D. 1978. “Measures of Inequality.” American Sociological Review 43:865-80.
- Firebaugh, Glenn. 2003. The New Geography of Global Income Inequality. Cambridge, MA: Harvard University Press.
This example Gini Coefficient Essay is published for educational and informational purposes only. If you need a custom essay or research paper on this topic please use our writing services. EssayEmpire.com offers reliable custom essay writing services that can help you to receive high grades and impress your professors with the quality of each essay or research paper you hand in.
See also:
ORDER HIGH QUALITY CUSTOM PAPER

Always on-time

Plagiarism-Free

100% Confidentiality
Special offer!
