This Lotka-Volterra Curve Essay example is published for educational and informational purposes only. If you need a custom essay or research paper on this topic, please use our writing services. EssayEmpire.com offers reliable custom essay writing services that can help you to receive high grades and impress your professors with the quality of each essay or research paper you hand in.
I n nature , many of the phenomena that capture our attention, such as the sight of a large predator in pursuit of prey, involve two or more interacting species. Alfred James Lotka (1880-1949) and Vito Volterra (1860-1940) independently developed a simple model to explain interactions between predators and prey, unlike the single species model. Born in the Ukrainian city of Lviv, then called Lemburg, Austria, Lotka was raised in France and arrived in the United States in 1902. He worked for U.S. government institutions-including the Bureau of Standards-followed by a position at Johns Hopkins University, before retiring as a statistician from the Metropolitan Life Insurance Company in New York in 1947. At that time, biologists were seeking ways to analyze the relationships of organisms with their surrounding environment. Lotka theorized that similar to the laws in physics, such as Newton’s Laws of Motion, the idea of natural selection could be established in its own right as a physical law.
Volterra was born in Ancona, Italy, and was interested in mathematics from an early age. Earning a doctorate in physics in 1882, he went on to a distinguished academic career in mathematical physics and was elected to the Royal Society in 1910. Volterra worked on partial differential equations during the 1890s and after World War I became interested in mathematical biology, applying the theory of differential equations to prey-predator interactions. Instead of looking at prey-predator populations as snapshots in time, differential equations allow us to observe population change continuously over time.
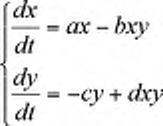
The Lotka-Volterra model relies on a set of two assumptions, (a) as the number of prey increases the birth rate of the predator also increases and (b) as the number of predators increases the death rate of the prey also increases. The general model for two species is expressed in the form of the following differential equations:

The first equation describes the change in the prey population. The second equation describes the change in the predator population. In these equations, dx!dt and dy!dt are respectively the prey and predator populations at any time, a is the prey’s natural growth rate when predators are absent, b is the prey’s death rate or rate at which predators eliminate or consume prey, c is the natural death rate of the predator in the absence of prey, and d is the efficiency of the predator or the rate at which predator numbers increase in the presence of prey.
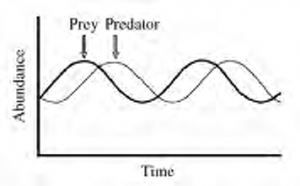
Early studies in the life sciences in North America provide a fitting backdrop to the subsequent interest in prey-predator relations that led to the LotkaVolterra model. The work of fur traders employed by the Hudson Bay Company in Canada in the 18th century resulted in two centuries of fur-trade records. Analysis by wildlife biologists showed that the populations of the snowshoe hare Lepus americanus and its predator the Canada lynx Lynx canadensis rise and fall at regular 10-year intervals. The highs in hare numbers are closely followed by highs in lynx numbers. These cycles of rise and fall in prey-predator numbers are predicted by the Lotka-Volterra model (Figure 1).

Figure 1 (Modified from Wilson and Bosser t, 1971)
The Lotka-Volterra curve is important because it was the first model of biological populations based on sound mathematical principles. The fact that in the wild, numbers of some prey-predators go up and down in a predictable cyclic fashion-as in the case of the snowshoe hare and the lynx-is often seen as a validation of the Lotka-Volterra model. However, dramatic ups and downs in animal numbers puzzle those ecologists who believe that nature tends to prevent the occurrence of such imbalances. Useful as it is, biologists now recognize that the model is too simplistic and does not include environmental factors that may significantly influence animal populations. Depending on the number of external factors investigated, single-factor or multiple-factor studies are conducted; for example, a study on the effect of food limitation will be single-factor, while food and disease taken together is a multiple-factor effect. Tests of the Lotka-Volterra model have resulted in attempts to improve it by incorporating such environmental factors.
The existence of the Lotka-Volterra model has helped improve our understanding of prey-predator interactions and the importance of food supplies. Importantly, the model and ecological studies resulting from it helped explain that the dramatic declines in herbivorous prey numbers affect not only their principal predator, but also have cascading effects on other predators, as well as on the structure of surrounding plant communities. Studies of preypredator populations have helped provide data necessary for habitat conservation plans to protect threatened species such as the Canada lynx.
Bibliography:
- Stuart Houston, Tim Ball, and Mary Houston, Eighteenth-Century Naturalists of Hudson Bay (McGill-Queen’s University Press, 2003);
- Charles J. Krebs et , “What Drives the 10-Year Cycle of Snowshoe Hares?,” BioScience (v.51, 2001);
- Egbert R. Leigh, “The Ecological Role of Volterra’s Equations,” in Some Mathematical Problems in Biology (The American Mathematical Society, 1968);
- Alfred J. Lotka, Elements of Mathematical Biology (Dover Publications, 1956);
- Alfred J. Lotka, Analytical Theory of Biological Populations (Plenum Press, 1998);
- Evelyn C. Pielou, Mathematical Ecology (John Wiley & Sons, 1977);
- Vito Volterra, “Variazioni e Fluttuazioni del Numero D’individui in Specie Animali Conviventi,” Mem. R. Accad. Naz. Dei Lincei (v.2, 1926);
- Edward O. Wilson and William H. Bossert, A Primer of Population Biology (Sinauer Associates, 1971).


